ART predictability deserves more than a glossary definition. This guide is designed to separate local team completion from the ART's ability to achieve valuable integrated PI Objectives.
The guidance treats planning as a continuous decision system connecting strategy, product choices, team capacity, technical evidence, dependencies, and feedback. The objective is a credible plan that can adapt without losing alignment.
Velocity and predictability answer different questions
Team velocity counts estimated story points completed within a team context. ART predictability compares achieved and planned business value across PI Objectives. Stable velocity can therefore coexist with weak predictability when objectives are poorly written, dependencies delay integration, features do not produce expected outcomes, scope changes, or release decisions prevent value from reaching customers.
A useful implementation identifies the affected PI Objective, the people with relevant knowledge, the decision owner, and the evidence needed by a clear date. Visibility without a decision path produces reporting rather than coordination.
The shared-environment example
Every team meets its velocity range, but a shared environment delays integrated validation and two PI Objectives miss their value. The improvement target belongs to integration flow and environment capability, not story-point output.
The example should be tested with teams, product roles, architecture, Business Owners, and other affected specialists. Each group sees different risks and constraints, and the shared plan improves when those differences become discussable.
A measurement comparison
| Area | Purpose or question | Evidence and action |
|---|---|---|
| Team velocity | Local story completion | Useful only within a stable team estimation context |
| Objective achievement | ART outcome delivery | Business Owner evaluation with context |
| Flow predictability | Consistency of completion and timing | Work-item distributions and service-level expectations |
| Release outcome | Value available to customers | Adoption, benefit, reliability, and feedback |
A diagnostic sequence
First inspect objective quality, then feature and dependency flow, integration frequency, release conditions, and customer evidence. Team velocity belongs later in the investigation and only within each team's own estimation context. This sequence prevents a system constraint from becoming a team performance problem.
Why point stability can hide ART risk
Leaders may pressure teams to raise or stabilize velocity when the constraint sits in cross-team decisions, feature readiness, integration, or product assumptions. This can increase point production while making risk and trade-offs less transparent.
When this pattern appears, adding another template or meeting normally increases delay. Inspect the policy, authority, capacity, architecture, or incentive that keeps the condition in place.
Measures to pair with achievement scores
- PI Objective clarity and achieved-value evidence.
- Dependency and decision ageing with consistent start and finish points.
- Feature flow time, WIP, blockage, and integration frequency.
- Risks raised early enough to change the plan.
- Customer, business, quality, and reliability outcomes beyond completion.
No single score proves planning effectiveness. Pair quantitative trends with context, and never turn risk reporting or confidence into an individual performance target.
Actions for RTEs and leaders
- Review objective quality before interpreting the score.
- Pair predictability with flow and integration evidence.
- Do not compare velocity across teams.
- Investigate system constraints without ranking teams.
Start with one objective, dependency, or planning decision. Record its current state, owner, needed-by date, and consequence. Review it on the ART cadence and change the plan when the evidence warrants it.
Where escalation belongs
Teams should resolve local execution choices within clear guardrails. Cross-team dependencies require coordination, while portfolio, supplier, compliance, funding, or enterprise policy decisions may require leadership authority. Escalation should carry options and evidence, not only urgency.
Set a response date for every escalated decision. When routine choices repeatedly move upward, clarify guardrails and delegate them. When local choices repeatedly create ART-wide harm, strengthen shared policy and integration evidence without removing all team autonomy.
Learning for ART and leadership roles
SAFe RTE training develops one role perspective for this work. Leading SAFe certification provides the complementary planning, product, coaching, or leadership perspective needed for cross-ART collaboration.
Training supports shared language and safe practice. Transfer occurs when participants use the techniques on real planning inputs, inspect what changed, and receive authority to improve the surrounding system.
Revisit the a diagnostic sequence whenever PI evidence, decision authority, or operating conditions change materially.
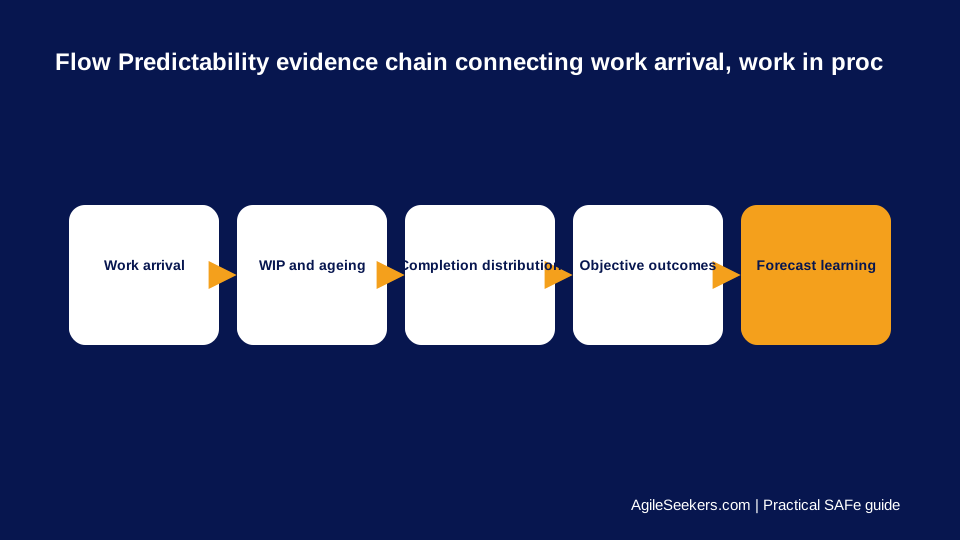
Predictability is a distribution, not a promise
Flow Predictability describes how consistently work is completed over time. A team can report stable velocity while features wait for another team, integration occurs late, or released work fails to produce the expected benefit. Story points are local estimates; they are not a common unit of customer value or elapsed time.
Build the forecast from comparable work
| Evidence | Question it answers | Misuse to avoid |
|---|---|---|
| Throughput distribution | How many comparable items finish in a period? | Using a single average |
| Flow Time distribution | How long do items take from start to finish? | Hiding percentiles and outliers |
| Flow Load and ageing | How much work is active and becoming risky? | Counting only blocked items |
| Objective evidence | Did completed work create the intended result? | Equating completion with benefit |
Explain variation before tightening a target
Segment by work-item type, service class, value stream, dependency pattern, and release path. A mixed distribution can look unstable because urgent defects, small enhancements, and cross-ART capabilities follow different systems. Improve the policy or system responsible for variation instead of pressuring teams to make estimates conform.
Run a calibrated forecast review
- Choose a stable item definition and start and finish boundaries.
- Plot recent completion and Flow Time distributions.
- Inspect ageing work and dependencies that can change the distribution.
- State the forecast as a range with a confidence level.
- Compare the outcome with the forecast and update assumptions.
Pair flow with value and reliability
- PI Objective achievement with Business Owner context.
- Customer adoption or operational outcome.
- Escaped defects and recovery performance.
- Feature and enabler mix.
- Decision and dependency ageing.
SAFe RTE certification training develops ART-level flow and planning capability. SAFe Advanced Scrum Master training helps coaches use flow evidence without turning metrics into team pressure.